Resistant Area Ahead
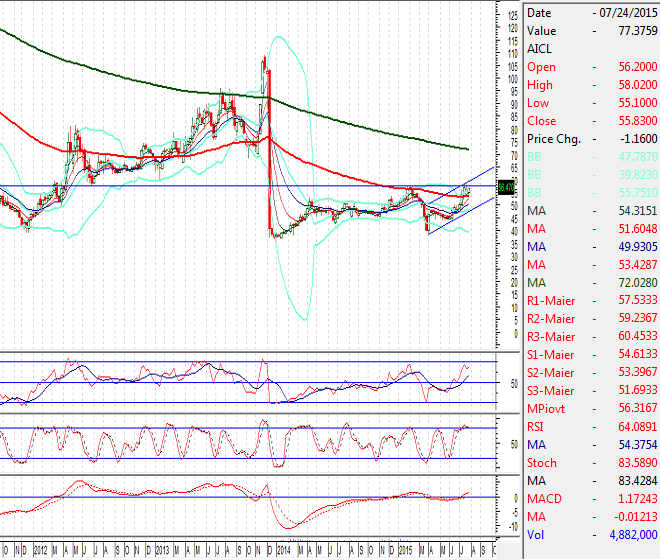
Our Pivot: 60.45
Our Preference: Short Sell AICL below 56.80 and add averages till 57.72 with strict stop loss of 60.45 and profit target at 53.02 with extension towards 50.47 and 48.
Alternate Scenario: Closing above 60.45 will call for 62.56 and 64.10.
NOTE: AICL is capped by a resistant trend line on Intra-day and Daily bases, weekly stochastic is also not supporting further bullish rally right now. Prices are also capped by resistant trend line weekly bullish price channel and a horizontal line.
Recommendations:
Short Sell below 56.80 and add averages till 57.72.
Historical Price Statistics of AICL:
Adamjee Insurance Co. Ltd. Non Life Insurance | Price: 56.47 Change: 2.58 2015-07-29 |
| Open: | 53.89 | 52 Week High: | 58.30 | Market Capitalization Mln: | 19.00 |
|---|
| High: | 56.49 | 52 Week Low: | 37.93 | Outstanding Shares. Mln: | 350.00 |
|---|
| Low: | 53.89 | 52 Week Avg.: | 48.70 | KSE AllShares % Weight-age: | 0.26 |
|---|
| Close: | 56.47 | 52 Week Max Vol.: | 16462500 | KSE100 % Weight-age: | 0.69 |
|---|
| Average: | 55.19 | 52 Week Min Vol.: | 72000 | KSE30 % Weight-age: | 1.05 |
|---|
| Volume: | 3520000 | 52 Week Total Vol.: | 516171500 | Data Last Updated: | 2015-07-29 |
|---|
Historical Payout |
| Equity,Sales and Profits are in million while EPS and Dividend in Rs, Bonus in % |
| Year End |
Equity |
Sales |
Profit Before |
Profit After |
EPS |
Dividend |
Bonus |
| 2013-12-31 | 13046.55 | 8016.88 | 2210.40 | 1966.16 | 5.62 | 3.50 | 182.93 |
| 2012-12-31 | 11539.80 | 7168.80 | 666.56 | 624.19 | 5.05 | 2.50 | 0.00 |
| 2011-12-31 | 10900.91 | 7992.93 | -41.97 | 132.18 | 1.07 | 1.00 | 0.00 |
| 2010-12-31 | 11035.00 | 7320.21 | 576.60 | 518.92 | 4.19 | 2.50 | 0.00 |
| 2009-12-31 | 10781.18 | 8940.83 | 2595.17 | 2434.48 | 21.65 | 3.00 | 10.00 |
| 2008-12-31 | 8444.19 | 8808.69 | 1175.88 | 1099.15 | 10.75 | 2.50 | 10.00 |
| 2007-12-31 | 7651.75 | 10089.84 | 4284.89 | 4201.25 | 41.09 | 3.00 | 0.00 |
| 2006-12-31 | 3787.87 | 6915.59 | 1684.75 | 1576.50 | 15.42 | 2.80 | 12.50 |
| 2005-12-31 | 2302.25 | 3997.33 | 1278.38 | 1163.25 | 14.08 | 3.00 | 10.00 |
3 Months Range | 6 Months Range |
| High: | 58.30 | Max. Volume: | 10523500 | High: | 58.30 | Max. Volume: | 11565500 |
|---|
| Low: | 43.55 | Min Volume: | 72000 | Low: | 37.93 | Min Volume: | 72000 |
|---|
| Average: | 48.59 | Total Vol.: | 101379000 | Average: | 48.94 | Total Vol.: | 185593500 |
|---|
History High & Low |
| History High: | 430.90 | High Date: | 2007-10-22 |
|---|
| History Low: | 33.60 | Low Date: | 2002-06-04 |
|---|
| History High Volume: | 19421000 | high Volume Date: | 2004-03-30 |
|---|
| History Low Volume: | 100 | Low Volume Date: | 2008-07-03 |
|---|
Historical Statistics
| Symbol |
Year |
High |
Low |
Average |
Max Volume |
Mini Volume |
Total Volume |
| AICL | 2015 | 58.30 | 37.93 | 49.38 | 13441000 | 72000 | 271620000 |
| AICL | 2014 | 53.55 | 36.85 | 46.15 | 16462500 | 157000 | 724519100 |
| AICL | 2013 | 108.99 | 36.36 | 77.34 | 7140000 | 1000 | 279851500 |
| AICL | 2012 | 81.55 | 44.99 | 62.38 | 5738335 | 1374 | 150241992 |
| AICL | 2011 | 96.40 | 38.82 | 64.15 | 3259563 | 1000 | 59998181 |
| AICL | 2010 | 135.20 | 63.05 | 94.17 | 9323791 | 27375 | 270230591 |
| AICL | 2009 | 130.40 | 41.60 | 89.99 | 13363705 | 100 | 771076360 |
| AICL | 2008 | 403.95 | 112.84 | 280.95 | 6014100 | 100 | 166718000 |
| AICL | 2007 | 430.90 | 149.30 | 278.97 | 8366300 | 78200 | 657967500 |
| AICL | 2006 | 190.40 | 98.00 | 150.97 | 9346700 | 39500 | 344877200 |
| AICL | 2005 | 153.00 | 56.25 | 90.78 | 7908900 | 8300 | 255345000 |
| AICL | 2004 | 122.50 | 49.70 | 72.64 | 19421000 | 36300 | 596235200 |
| AICL | 2003 | 83.75 | 37.50 | 56.63 | 16313000 | 35000 | 464451500 |
| AICL | 2002 | 66.30 | 33.60 | 45.77 | 9912500 | 20000 | 342836000 |
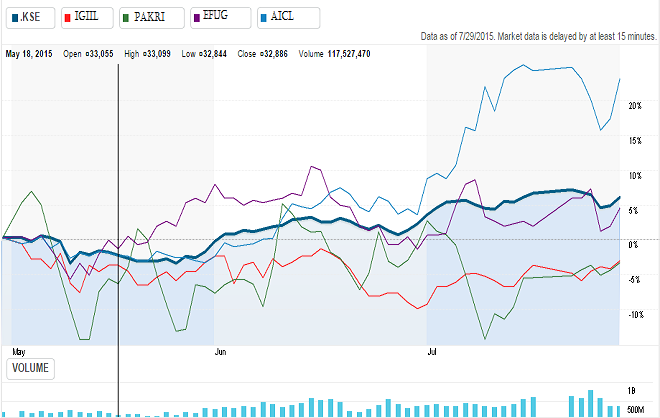
KSE100 Index and Sector Comparison:
 Weekly Chart with Supports and Resistances:
 RESPONSIVE
12
CSS
3
HTML
1
JAVASCRIPT
28
DESIGN
6
DEVELOPMENT
3
 Weekly Chart with Supports and Resistances:
 RESPONSIVE
12
CSS
3
HTML
1
JAVASCRIPT
28
DESIGN
6
DEVELOPMENT
3

3 COMMENTS
John Doe
June 29, 2014 - 11:23 Proin eget tortor risus. Cras ultricies ligula sed magna dictum porta. Pellentesque in ipsum id orci porta dapibus. Lorem ipsum dolor sit amet, consectetur adipiscing elit.Diana Doe
June 29, 2014 - 11:23 Proin eget tortor risus. Cras ultricies ligula sed magna dictum porta. Pellentesque in ipsum id orci porta dapibus. Lorem ipsum dolor sit amet, consectetur adipiscing elit.Melissa Doe
June 29, 2014 - 11:23 Proin eget tortor risus. Cras ultricies ligula sed magna dictum porta. Pellentesque in ipsum id orci porta dapibus. Lorem ipsum dolor sit amet, consectetur adipiscing elit.Peter Doe
June 29, 2014 - 11:23 Proin eget tortor risus. Cras ultricies ligula sed magna dictum porta. Pellentesque in ipsum id orci porta dapibus. Lorem ipsum dolor sit amet, consectetur adipiscing elit.LEAVE A COMMENT