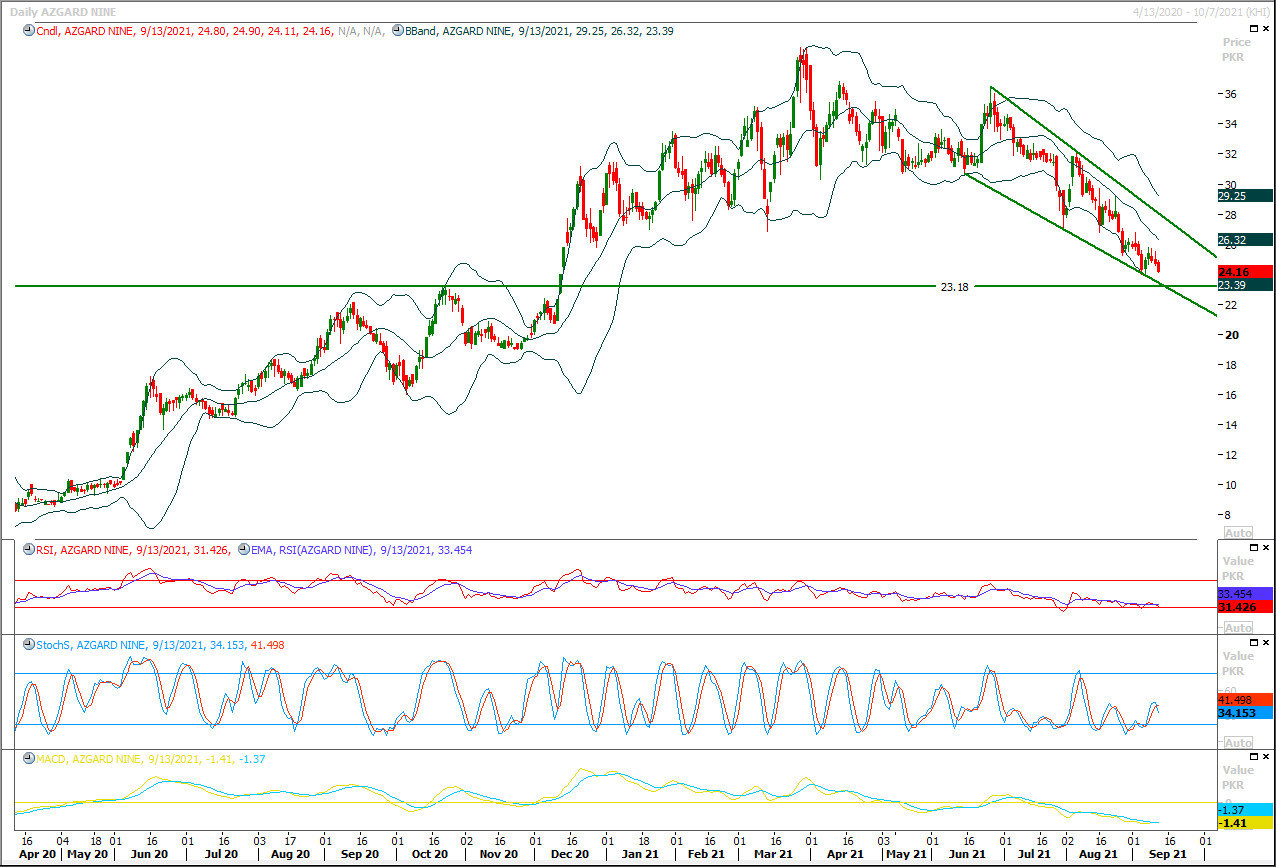
ANL Azgard Nine Limited Descending Wedge Formation 14th Sep 2021
Descending Wedge Formation on daily chart
ANL is caged in a descending wedge on daily chart and its getting support from supportive trend line of that wedge. Meanwhile a strong horizontal supportive region is standing at 23.00 where it may try to establish ground against current bearish pressure. As per our perception it needs to stay cautious until it clearly shows a reversal sign.
As per descending wedge strategy breakout of this wedge in either direction would give a strong push in respective direction but it needs to keep in mind that bearish breakout may not attract a long bearish rally as horizontal supportive regions are standing ahead. While bullish breakout may call for 30.75 Rs but for that ride it needs to wait for bullish breakout otherwise this could be a trap.
Please do your own research before trading as this content is being shared only for information purpose only.

ANL 1
Quick Snapshot
364,057,298
449,349,439
0.00
22.00
27.50
24.16
52 Weeks Range
Pivots
| Level | 1st | 2nd | 3rd | Supports | 23.88 | 23.60 | 23.09 | Resistances | 24.67 | 25.18 | 25.46 |
|---|
