ASC Al Shaheer Corporation Technical Update 3rd Sep 2021
ASC Al-Shaheer Corporation
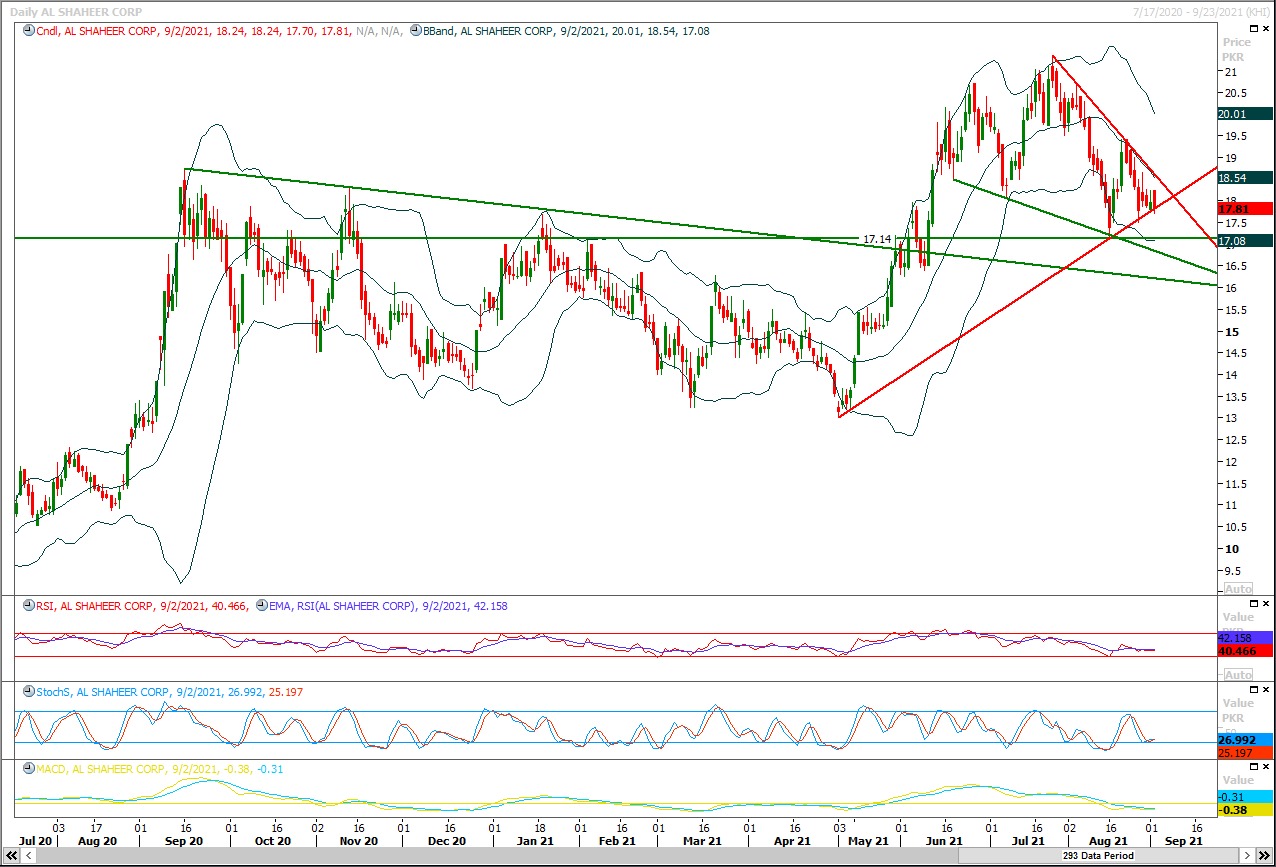
ASC is caged in a descending wedge on daily chart and have completed its 50% correction of its last bullish rally inside this wedge, meanwhile it's being supported by a rising trend line.
Meanwhile a strong horizontal supportive region is standing at its 50% correction level and its being supported by previous resistant trend line on its 61.8% correction level. These both scenarios show that breakout above 18.30 will call for 19.50 and in case it would succeed in closing above this region on daily chart then it amend its previous high. But all depends on breakout of current wedge in upward direction. share your views what would be best strategy to trade this script.
Please do your own research before trading

ASC 5
Overview
Quick Snapshot
Free Float
149,969,415
O/S Shares
142,117,427
Market Cap. (m)
0.00
Var Value
17.00
Hair Cut
22.50
Last Price
17.43
Price Adjusted
52 Weeks Range
52w Low
52w High
Intraday
Pivots
| Level | 1st | 2nd | 3rd | Supports | 17.22 | 17.00 | 16.69 | Resistances | 17.75 | 18.06 | 18.28 |
|---|
Adjusted
Price Performance
Time Frame
Price Ch
%Ch
MTD Price Return
0.13
1.18
QTD Price Return
0.13
1.18
3M Price Return
-3.62
-24.54
6M Price Return
-3.06
-21.56
9M Price Return
-9.77
-46.75
YTD Price Return
-2.52
-18.46
1Y Price Return
-3.37
-23.24
3Y Price Return
-1.37
-10.96
5Y Price Return
-23.34
-67.71
