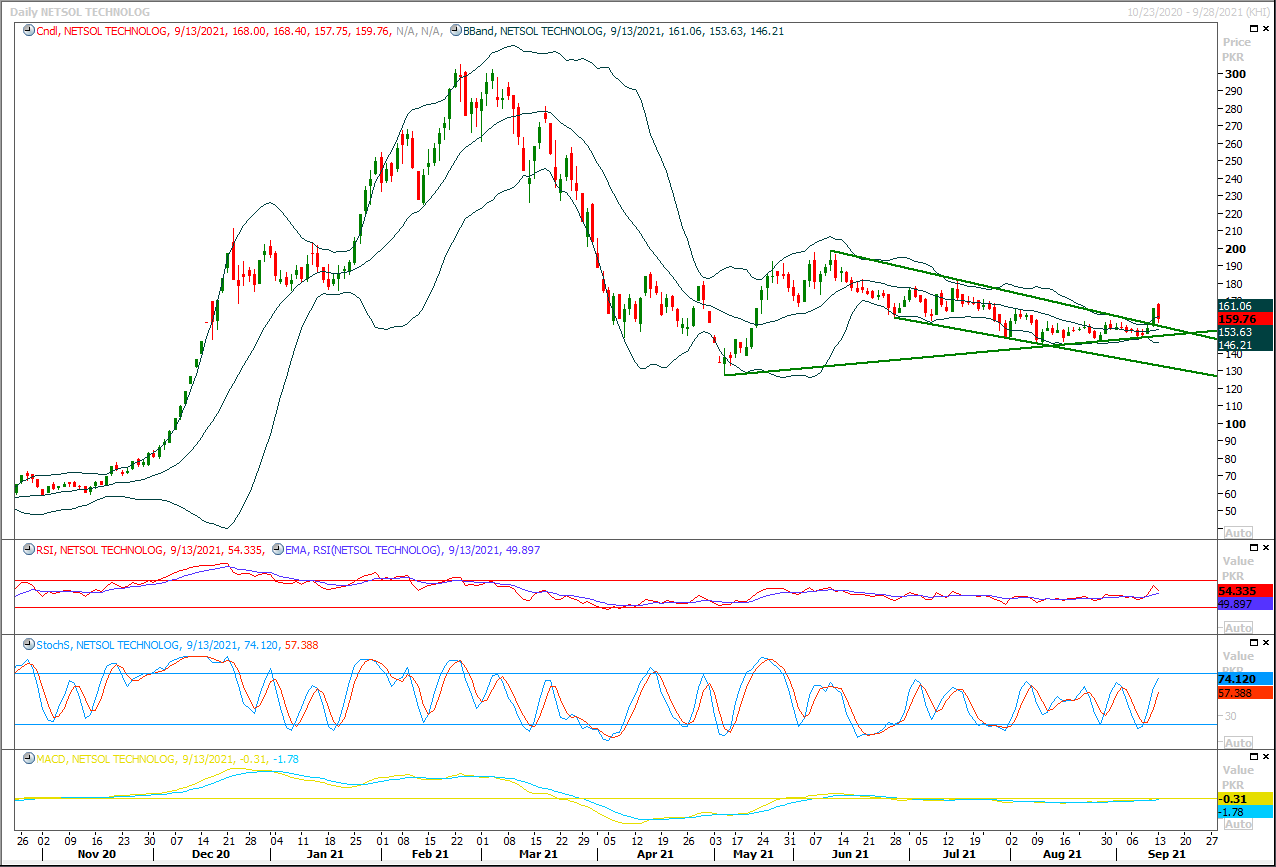
NETSOL Netsol Technologies Limited Bullish breakout of daily triangle 14th Sep 2021
Bullish breakout of daily triangle
NETSOL technologies have given bullish breakout of its daily triangle and coming back to retest resistant trend line of said triangle as supportive one but it needs to stay cautious because its moving back after facing rejection from strong horizontal resistant region which falls at 168.
Cheat Pattern may take place usually breakout of triangles call for expansion immediately but sometimes breakouts become a trap for technical traders if resistant regions are standing next to breakout levels therefore its necessary to watch chart carefully to set targets. Same scenario may take place in NETSOL if it would not succeed in maintaining above supportive trend line of previous triangle which falls at 148. it would be considered bullish as long as its trading above 148.
Please do your own research before trading as this content is being shared only for information purpose only.

NETSOL 3
Quick Snapshot
31,442,923
89,836,923
0.00
14.50
17.50
159.76
52 Weeks Range
Pivots
| Level | 1st | 2nd | 3rd | Supports | 155.54 | 151.32 | 144.89 | Resistances | 166.19 | 172.62 | 176.84 |
|---|
